Annual Statistical Report on UN Procurement
-
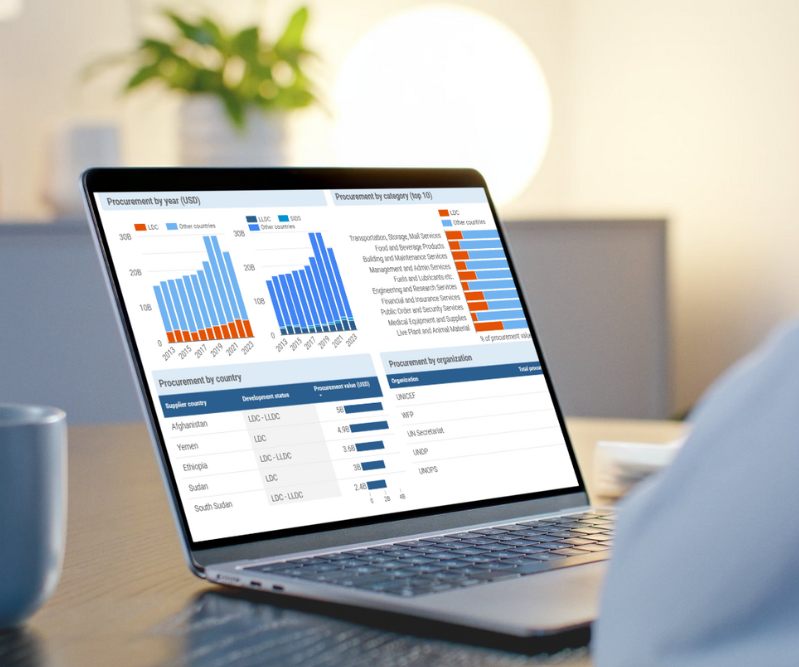
UN Procurement Data Portal
UN Procurement
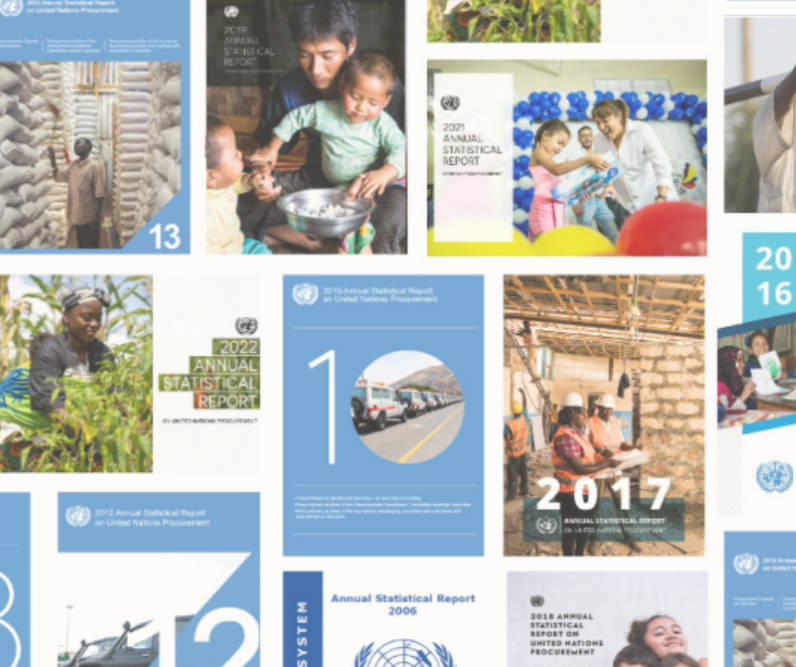
Data PortalThe United Nations procures goods and services from suppliers all over the world to support its activities and operations. Procurement statistics have been collected from organizations in the United Nations system and reported together since 1984 through the Annual Statistical Report on United Nations Procurement (ASR).
This UN Procurement Data portal provides access to the latest procurement statistics, including information on United Nations organizations’ efforts to integrate sustainability considerations into their procurement processes, through interactive data dashboards as well as the report itself.